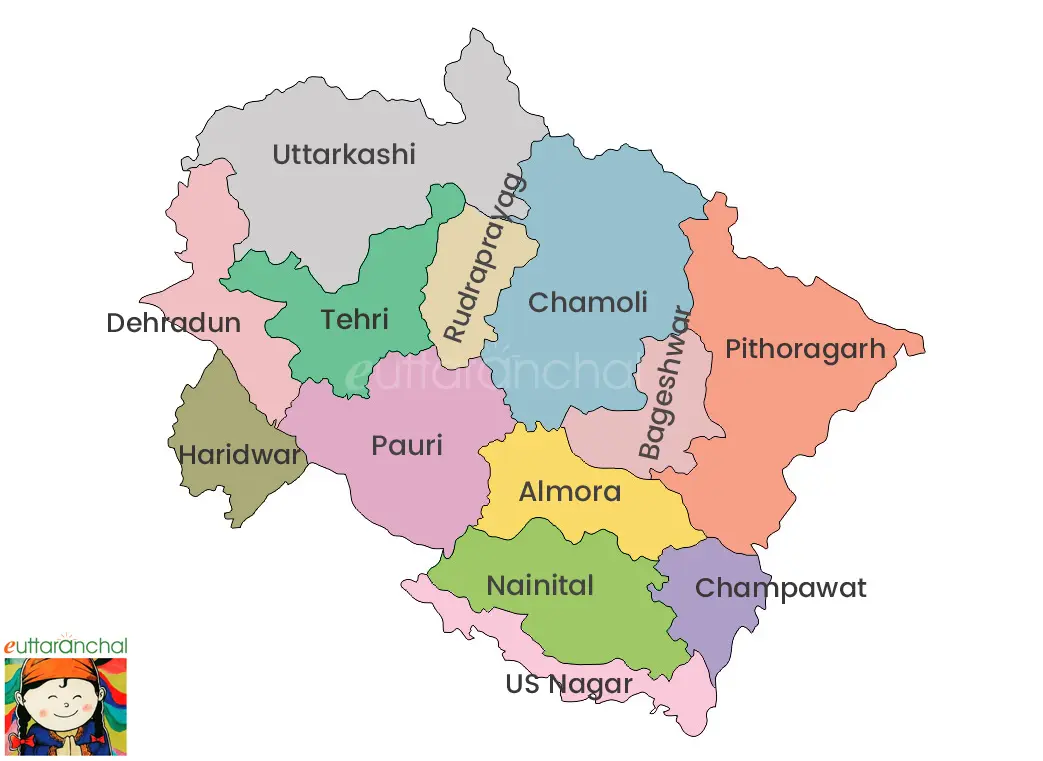
Population data of all 13 districts of Uttarakhand - latest population, literacy rate, sex ratio, child population, male female population, ST SC population and list of villages in each of the districts of Uttarakhand. The data is as per 2011 Census.
Click on the individual district's name to view the detailed statistics of a particular district and aslo get the list of blocks, tehsils and villages in that district.
| District | Population | Literacy | Sex Ratio |
|---|---|---|---|
| Almora | 622,506 | 80.47% | 1139 |
| Bageshwar | 259,898 | 80.01% | 1090 |
| Chamoli | 391,605 | 82.65% | 1019 |
| Champawat | 259,648 | 79.83% | 980 |
| Dehradun | 1,696,694 | 84.25% | 902 |
| Hardwar | 1,890,422 | 73.43% | 880 |
| Nainital | 954,605 | 83.88% | 934 |
| Pauri Garhwal | 687,271 | 82.02% | 1103 |
| Pithoragarh | 483,439 | 82.25% | 1020 |
| Rudraprayag | 242,285 | 81.3% | 1114 |
| Tehri Garhwal | 618,931 | 76.36% | 1077 |
| Udham Singh Nagar | 1,648,902 | 73.1% | 920 |
| Uttarkashi | 330,086 | 75.81% | 958 |

Population Data of Uttarakhand Districts
Detailed population data of each districts of Uttarakhand.
| District | Females | Males | Children | ST | SC |
|---|---|---|---|---|---|
| Almora | 331,425 | 291,081 | 80,082 | 1,281 | 150,995 |
| Bageshwar | 135,572 | 124,326 | 35,560 | 1,982 | 72,061 |
| Chamoli | 197,614 | 193,991 | 52,161 | 12,260 | 79,317 |
| Champawat | 128,523 | 131,125 | 37,028 | 1,339 | 47,383 |
| Dehradun | 804,495 | 892,199 | 201,652 | 111,663 | 228,901 |
| Hardwar | 885,127 | 1,005,295 | 285,693 | 6,323 | 411,274 |
| Nainital | 460,939 | 493,666 | 124,272 | 7,495 | 191,206 |
| Pauri Garhwal | 360,442 | 326,829 | 83,901 | 2,215 | 122,361 |
| Pithoragarh | 244,133 | 239,306 | 63,293 | 19,535 | 120,378 |
| Rudraprayag | 127,696 | 114,589 | 32,046 | 386 | 47,679 |
| Tehri Garhwal | 320,945 | 297,986 | 84,657 | 875 | 102,130 |
| Udham Singh Nagar | 790,119 | 858,783 | 229,162 | 123,037 | 238,264 |
| Uttarkashi | 161,489 | 168,597 | 46,307 | 3,512 | 80,567 |